Bruce Brammall, 25 October 2017, Eureka Report
SUMMARY: SMSF expenses have nearly tripled in just five years! Have you lost control of your super fund costs?
Trustees of self-managed super funds appear to have lost control of their expenses – average expenses per fund have nearly tripled in five years.
The cost blowout is particularly alarming because the average costs of SMSFs have now risen to have a headline figure that is similar to other low-cost providers, such as industry funds.
Figures from the Australian Tax Office show the average dollar cost of running a super fund have increased from around $2807 a year in FY12 to $7864 a year in FY16.
That amounts to an increase of 180 per cent over that five-year period.
Even taking into account the increase in the average size of Australian SMSFs over that time, expenses as a proportion of assets have more than doubled, with an increase of 124%.
Between FY12 and FY16, the average assets of a SMSF have grown from $901,597 to $1,126,863. This means that the average SMSF expense ratio, compared to those assets, had increased from 0.31% to 0.7%.
The average cost of an industry fund is approximately 0.7% to 0.8%.
It is unfair to directly compare these costs figures for SMSFs to the likes of industry funds. One major reason is that the ATO’s figures count the cost of insurance as an expense cost to the fund. However, with all other funds, including industry funds, this would be included as an extra cost and not included in the average cost incurred as management fees of the fund.
Insurance options for SMSFs are generally better, if more expensive. I would argue they should be stripped out from the ATO’s figures, because super funds are completely optional, where accounting, audit and asset purchase costs are not. Also, SMSFs could opt to take out insurance elsewhere (including leaving some funds with industry funds for cheaper insurance). But for fairness sake, the ATO should strip out insurance costs to another category.
The ATO has further broken down expenses into two categories, “investment expenses” and “administration and operating expenses”.
Investment expenses are listed as:
- Interest expenses
- Insurance premiums – members
- Investment expenses
- Forestry management investment scheme expenses.
Administration and operation expenses are calculated as:
- SMSF auditor fee
- Management and administration expenses
- Other amounts
- Supervisory levy
Investment expenses increased from $1.44 billion to $4.004 billion over that five year period. Administration and operating expenses increased from $1.367 billion to $3.86 billion.
Over the same period, increases for other base statistics for SMSFs have not experienced a similar increase.
Contributions to super funds have risen by around 21.3% over the same period, from $26.6 billion to $32.3 billion. Benefit payments to members have increased by 63.5% to $37 billion over the same period.
The ATO’s statistics also show a steady increase in average assets per member, from $475,000 to $599,300 and in median assets per member from $274,600 to 362,300. They are increases of 26.1% and 32% respectively.
The average SMSF has grown from $901,600 to $1,126,900, an increase of nearly 25%, while the median assets per SMSF has grown by 30.5% to $642,000.
It’s because most other signs suggest that SMSFs have grown by around 20-35% that it’s so concerning that costs have grown by around 180%.
Unfortunately, the ATO gives no explanation, not even a hint, as to why expenses has grown so quickly over that period.
(If you have experienced rapid growth in your SMSF costs, please email me at bruce@brucebrammallfinancial.com.au and tell me where the blowouts have been. If I get enough responses, I’ll write a column to share your joint experiences.)
The ATO also produces tables that show the average SMSF sizes. See Table 1.
Table 1: Average SMSF size by range.
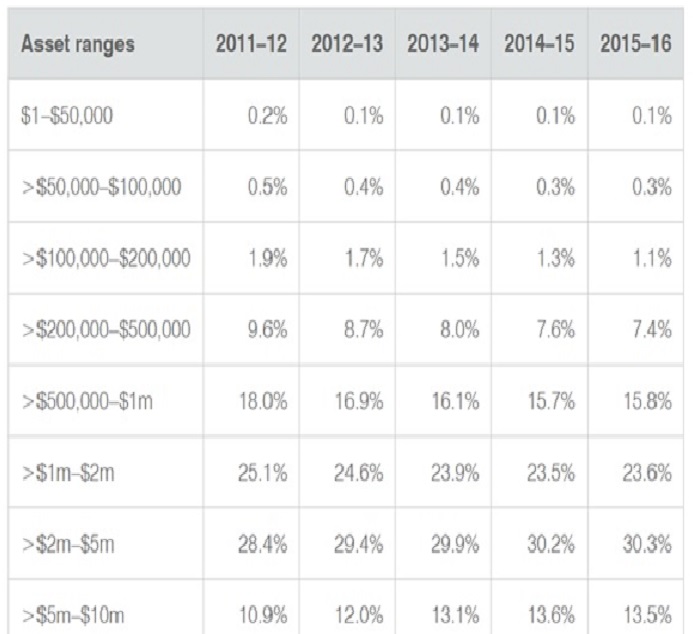
Source: ATO
As the SMSF asset pool grows – now totalling more than $2.3 trillion – the number of funds in every range under $2 million has fallen, with all funds from $2 million upwards has increased.
The number of $10 million plus funds has increased by around 43%.
But I would like to hear more about the increase in costs from readers. If you have time to explain what has happened to the cost or expense line of your super fund, please drop me a line to the link above.
*****
The information contained in this column should be treated as general advice only. It has not taken anyone’s specific circumstances into account. If you are considering a strategy such as those mentioned here, you are strongly advised to consult your adviser/s, as some of the strategies used in these columns are extremely complex and require high-level technical compliance.
Bruce Brammall is managing director of Bruce Brammall Financial and is both a licensed financial adviser and mortgage broker. E: bruce@brucebrammallfinancial.com.au . Bruce’s book, Mortgages Made Easy, is available now.